Americans should be concerned about the amount of fluoride they consume. It is not found only in drinking water; fluoride exposure can also come from toothpaste, mouthwash, certain pharmaceuticals, professionally applied dental treatments, and other everyday sources. Yet most discussions of fluoride tend to examine these sources individually rather than asking a broader question: What is the cumulative effect of repeated exposure from multiple sources over decades of a person’s life?
To decide for yourself what level of fluoride exposure you consider appropriate, it is first necessary to understand how fluoride became so deeply embedded in modern public health and dental practice. That story—shaped by scientific discovery, industrial development, government policy, dentistry, medicine, and decades of controversy—is the subject of this paper.
For decades, Americans have been given a remarkably simple explanation of water fluoridation. It appears to me to be one of the earliest examples of supplementing the American experience with helpful naturally occurring elements.
In 1995, the Centers for Disease Control and Prevention described it this way:
“Water fluoridation is the deliberate addition of the natural trace element fluorine (in the ionic form as fluoride) into drinking water in accordance with scientific and dental guidelines.”
Read that sentence carefully.
It creates a reassuring picture: fluoride exists naturally in water; some communities don’t have enough; therefore water utilities simply adjust the amount of this naturally occurring substance to a level believed to prevent cavities.
That description isn’t entirely false. But is the fluoride we are adding to our water supply the same naturally occurring trace element that was given credit in the early 1900s for improving dental health?
A brief review of the industrial history shows that is not the case.
The fluoride compounds most commonly used today to fluoridate American drinking water do not come from collecting naturally fluoridated water or grinding up naturally occurring calcium fluoride. Much of the fluorosilicic acid used by American water systems is produced in connection with the manufacture of phosphate fertilizer.
The Environmental Protection Agency describes the process plainly. Phosphate rock contains fluorine. When that rock is processed with sulfuric acid to manufacture phosphoric acid for fertilizer, fluoride-containing gases — including hydrogen fluoride (HF) and silicon tetrafluoride (SiF₄) — are released.
Those gases cannot simply be discharged into the atmosphere. They are captured in wet scrubbers. When they are scrubbed with water, something useful — and problematic — happens.
The EPA’s 2022 Fluorosilicic Acid (FSA) Supply Chain Profile states:
“When the gases are scrubbed with water, FSA is formed as a waste stream.”
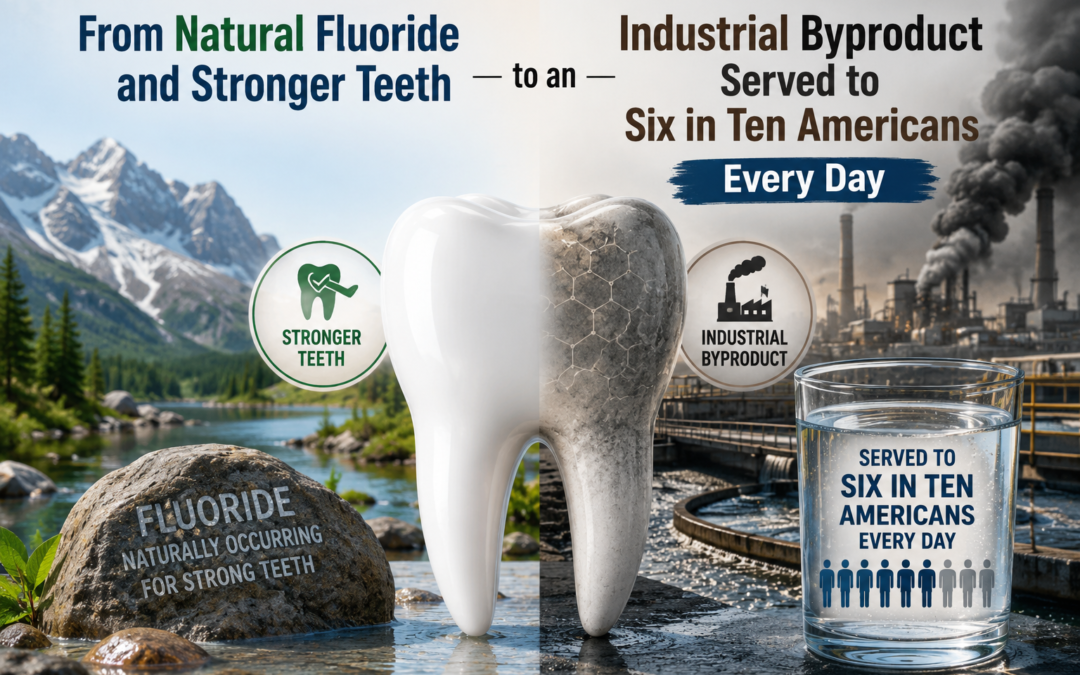
Today its primary commercial use is water fluoridation. CDC data indicate that water systems deliberately adjusting fluoride levels, together with systems purchasing that treated water, serve more than 200 million people — nearly six in ten Americans.
How did we get from observing fluoride in groundwater to adding an industrially recovered material to drinking water serving more than half the country?
The Original Fluoride Discovery
The scientific story began with a legitimate observation.
During the early twentieth century, dentists noticed that people in certain communities developed mottled or stained teeth — what became known as dental fluorosis.
The trail started in Colorado Springs. In 1901 a young dentist named Frederick McKay arrived there and found that many of his patients had permanently brown-stained enamel. With G.V. Black he spent years showing the stain tracked the local water, not hygiene or diet. He still did not know what was in the water.
That answer came in 1931. H. V. Churchill, a chemist at Alcoa’s plant in Bauxite, Arkansas, ran spectrographic tests on water from a stained-teeth town and found high fluoride. Independently, H. V. and Margaret Smith at the University of Arizona reached the same conclusion on water from St. David, Arizona. The mottled communities had naturally elevated fluoride in their drinking water.
Then came another observation: populations with some of that naturally occurring fluoride also appeared to have fewer cavities.
- Trendley Dean and other researchers at the U.S. Public Health Service mapped that relationship through the 1930s and early 1940s — how much fluoride in the water, how much stain, how much decay. Eventually public-health officials proposed an experiment: if naturally occurring fluoride was associated with fewer cavities, could adding fluoride to low-fluoride water reproduce the apparent dental benefit?
Grand Rapids, Michigan, became the first major American test. On January 25, 1945, Grand Rapids began artificially fluoridating its municipal water with sodium fluoride, a simple salt: one sodium ion and one fluoride ion.
The experiment was originally intended to continue for roughly a decade or longer while researchers compared dental outcomes with those in an unfluoridated control community. The results at five years were positive. In 1950 — only five years after Grand Rapids began — the U.S. Public Health Service endorsed community water fluoridation.
About the same time, another American industry was confronting an entirely different fluoride problem.
The Fertilizer Industry Had a Fluoride Problem
Phosphate fertilizer is older than water fluoridation by a century.
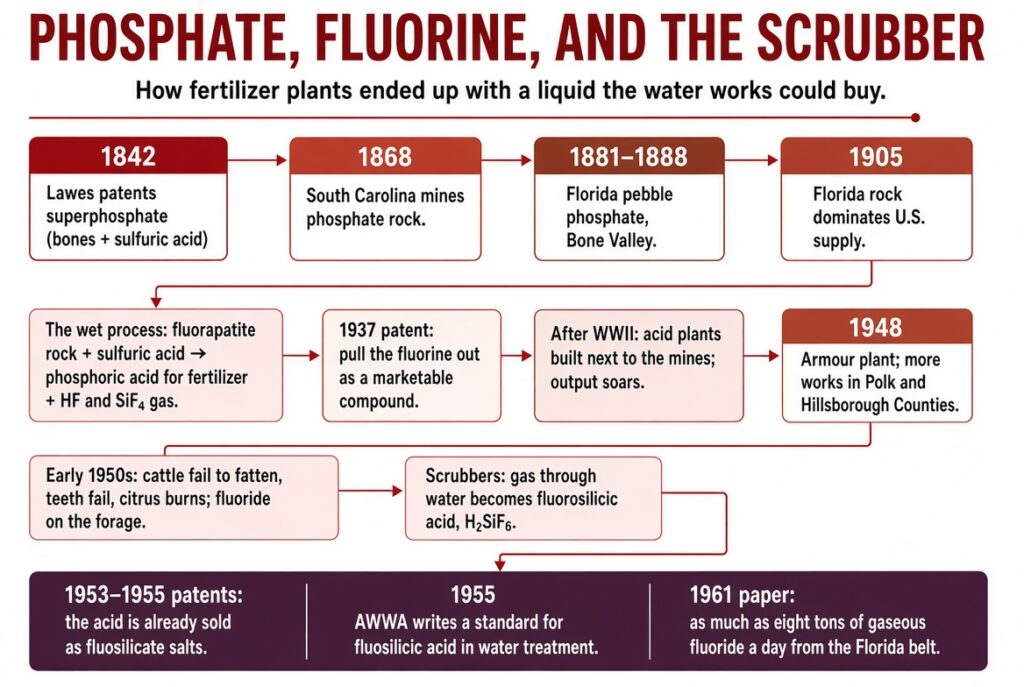
In 1842 John Bennett Lawes patented superphosphate: bones treated with sulfuric acid so plants could use the phosphorus. By 1843 he was making it in England. American works followed in Baltimore and Philadelphia. The feedstock was still bones.
That changed when the rock was found. South Carolina began mining phosphate rock in 1868. In 1881 Francis LeBaron, surveying Florida’s Peace River for the Army Corps, found pebble phosphate in the riverbed. Commercial Florida production followed in 1887–88. Hard-rock and land-pebble mining opened the central Florida field that came to be called the Bone Valley — so named because the draglines kept turning up fossils. From about 1905 Florida land-pebble was the dominant American source.
Phosphate rock is not clean calcium phosphate. It is fluorapatite: calcium, phosphate, and fluorine locked in the same mineral, with silica mixed in. Treat that rock with sulfuric acid — the wet process — and you get phosphoric acid for fertilizer. You also drive off fluorine as hydrogen fluoride and silicon tetrafluoride.
A 1937 patent on recovering values from phosphate rock already described the aim as taking most of the fluorine out of the rock “as a useful marketable compound.”
After World War II the industry stopped shipping most of the rock north and built the acid plants next to the mines. Output soared. Every extra ton of wet-process acid meant more of those gases leaving the reactor.
The gases were not theoretical. On the ground in central Florida it was not ordinary.
After Armour opened a chemical fertilizer and sulfuric-acid plant in 1948, more than a dozen processing works followed in Polk and Hillsborough Counties. By the early 1950s ranchers were reporting herds that would not fatten. Legs deformed. Teeth wore away or fell out. Calves were stillborn. Veterinarians diagnosed fluoride poisoning from forage dusted by plant stacks. Citrus leaves bleached. Gladiolus crops failed. Later accounts of those years put the damage at roughly 150,000 acres of cattle land abandoned and 25,000 acres of citrus harmed.
The plants had to catch what they had been putting up the stack. The engineering answer was wet scrubbing. Pass the gases through water. The fluoride leaves the air and enters a liquid. The harm did not vanish because it changed phase. The scrubber liquor is fluorosilicic acid.
In 1950 Frank J. McClure of the Public Health Service compared sodium fluoride with sodium fluosilicate and concluded the fluorine was available and that the salt could be considered as a substitute. That is a substitution paper. It is not a decade-long trial of hydrofluosilicic acid in a city water supply.
By 1951 the Public Health Service was discussing three principal fluoridation chemicals: sodium fluoride, sodium silicofluoride, and hydrofluosilicic acid. Cost and handling were part of the discussion. Sodium fluoride was the chemical in Grand Rapids. What had been shown about the other two was thinner.
In 1952 a federal survey counted 137 systems on sodium fluoride, 104 on sodium silicofluoride, and 26 already on hydrofluosilicic acid.
A 1955 patent on treating phosphate rock, filed in July 1953, states that at a number of American superphosphate plants the volatilized fluorine was recovered as hydrofluosilicic acid “and is marketed chiefly as barium, zinc, ammonium, magnesium and sodium fluosilicates, principally the latter.”
A patent filed in 1954, later issued as “Disposal of fluorine wastes,” described the fumes from a phosphate-fertilizer plant as something that had to be converted into a form that could be “economically and safely disposed of.”
In 1955, W. L. Hill and K. D. Jacob, writing for the mining profession, treated recovery of fluorine from wet-process plants as ordinary industrial practice. That same year the American Water Works Association — a trade group of utility men founded in St. Louis in 1881 — issued a formal standard for fluosilicic acid used in water treatment.
Ten years after Grand Rapids started with a bag of sodium fluoride, the liquid from the phosphate plant had a specification. Municipal drinking water.
A 1961 paper in the Journal of the Air Pollution Control Association estimated gaseous fluoride from the Florida belt at as much as eight tons a day.
Eventually, the Byproduct Won
Over subsequent decades, fluorosilicic compounds became dominant in American water fluoridation.
EPA researchers reported that by 1992, fluorosilicic acid supplied systems serving approximately 62.6 percent of the artificially fluoridated population. Sodium fluorosilicate accounted for another 28.2 percent. Sodium fluoride — the chemical used in Grand Rapids — accounted for only about 9.2 percent.
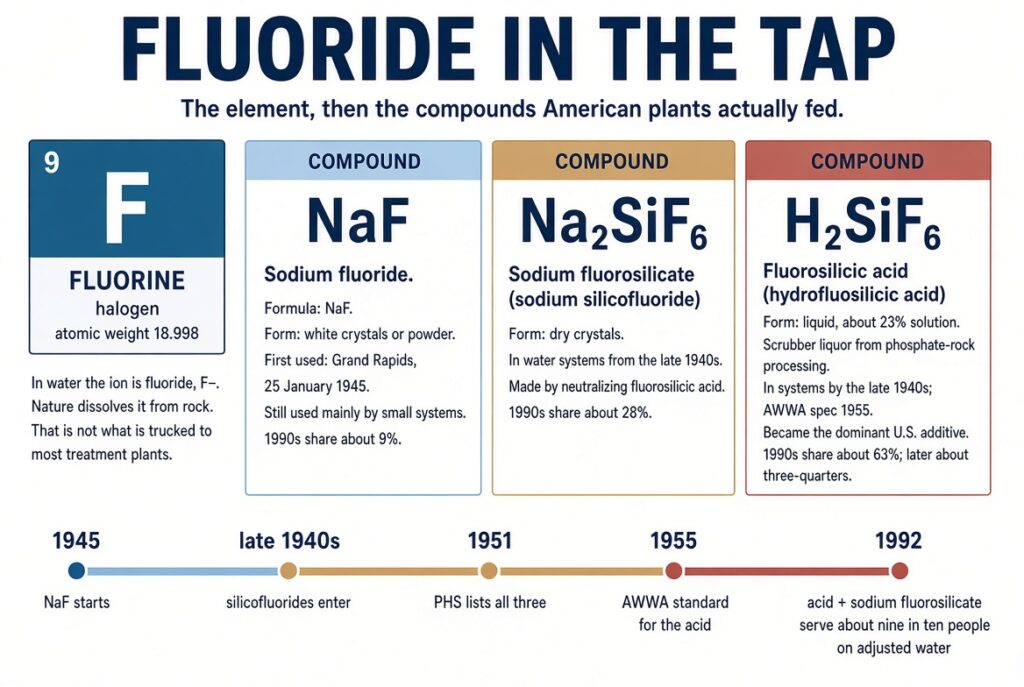 That means that by the early 1990s, roughly nine out of ten Americans receiving artificially fluoridated municipal water were served by systems using fluorosilicate chemicals rather than sodium fluoride.
That makes the CDC description worth reading again:
“Water fluoridation is the deliberate addition of the natural trace element fluorine (in the ionic form as fluoride) into drinking water…”
Chemically, the CDC is describing the fluoride ion that exists in the finished water. Industrially, that sentence tells almost none of the story. The material being delivered to many water-treatment facilities is fluorosilicic acid produced through phosphate processing.
Both statements can technically be true. They leave dramatically different impressions.
“Once It’s in the Water, It’s All the Same”
Public-health authorities argue that it ultimately doesn’t matter where the fluoridation chemical originated. Fluorosilicic acid dissociates and hydrolyzes when sufficiently diluted in drinking water. Therefore, according to the conventional explanation, the resulting fluoride is effectively indistinguishable from fluoride that was naturally present.
That sounds reassuring. A pretty straightforward question: where is the human experiment demonstrating that?
The chemistry has been examined for decades. One influential review was written in 2002 by EPA chemist Edward T. Urbansky: Fate of Fluorosilicate Drinking Water Additives. Urbansky reviewed equilibrium chemistry and concluded that under ordinary drinking-water conditions essentially no intact hexafluorosilicate should remain at equilibrium.
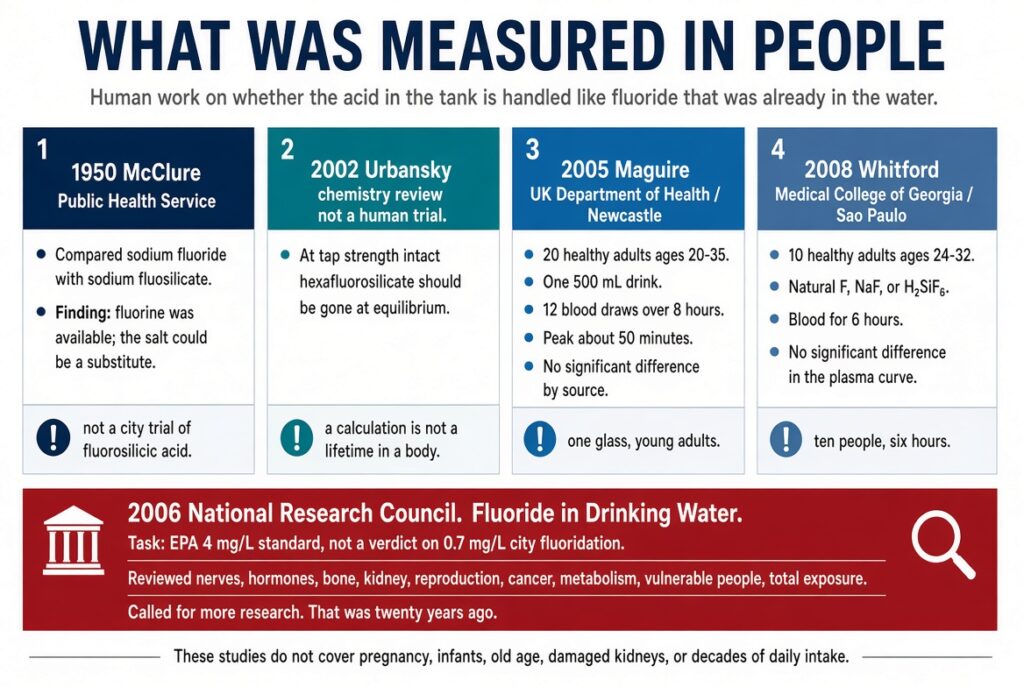
A chemical-equilibrium calculation is not the same thing as a lifetime biological experiment. The question I wanted answered is different:
Does the human body handle fluoride derived from fluorosilicic acid the same way it handles fluoride naturally present in water?
There have been human experiments on part of that question. They are small.
Twenty People, Eight Hours
In 2005, A. Maguire and colleagues at Newcastle University published a study the UK Department of Health had commissioned. Twenty healthy adults, ages about 20 to 35, each drank 500 milliliters of water. Some of the water was naturally fluoridated. Some had fluoride added. A line went into a vein. One blood sample before the drink, then eleven more over the next eight hours. The plasma peak they reported came at about fifty minutes.
They did not find a statistically significant difference by source.
That is real data. It is also twenty young adults and one glass. An eight-hour curve can catch the rise in blood and the first decline. In a healthy adult, a large share of an absorbed dose is already moving into bone.
The National Academies, 2006
In 2006, the National Research Council of the National Academies published Fluoride in Drinking Water: A Scientific Review of EPA’s Standards. The committee was not asked to decide whether community water fluoridation at approximately 1 mg/L should continue. It was evaluating EPA’s drinking-water standards, particularly the maximum contaminant level of 4 mg/L.
Its examination of fluoride biology was extensive. The committee reviewed neurological effects, endocrine function, bones, kidneys, reproduction, cancer, fluoride metabolism, susceptible populations, and total exposure. It identified unanswered questions. It called for additional research, over and over. That was 2006. Twenty years ago.
Which leads to the question that started this: what have we learned, what are we doing, what has changed?
Ten People, Six Hours
In 2008, Gary Whitford and colleagues published a second study. Ten healthy adults, ages 24 to 32, drank 500 milliliters containing fluoride that was natural, or added as sodium fluoride, or added as fluorosilicic acid. Blood before the drink, then nine more draws over six hours. Plasma only.
Again, no significant difference in the main measurements.
Ten people. Six hours. One drink.
Neither study was built for pregnancy, old age, bad kidneys, a developing brain, thyroid, bone over decades, cancer, or the pile-up from water plus food plus toothpaste plus medicine. They measured the first hours in blood after a single glass. That is all they can carry.
The Question Isn’t Whether Fluoride Prevents Cavities
The cavity question has owned this fight for decades. It is not the only question, and it may not be the one that matters most now.
Suppose naturally occurring fluoride reduces decay. That still does not settle whether putting a biologically active chemical into everyone’s tap is the way to deliver it. A 200-pound adult drinking a liter does not receive the same dose, per pound, as a 25-pound child drinking the same water. A person with working kidneys is not the same as a person whose kidneys are already tired. Water is not the only source anymore. There is tea, processed food and drinks made with city water, toothpaste, pharmaceuticals. These are not all the same compound. They still add up in one body.
The ten healthy adults and the six-hour blood curve do not answer what happens if a child drinks chemically infused water from infancy to old age. That would take different work: years, not hours; children and sick people, not only students; total intake, not one glass.
I started this thinking I would find a simple dental story. I found mottled teeth in Colorado, a chemist in Arkansas, Grand Rapids and a bag of sodium fluoride, then a fertilizer belt that had to catch its own stack gases, cattle downwind of those plants, and a liquid from the scrubber that became the usual chemical in American tap water. None of that, by itself, proves the finished glass is harming you. It does mean the public story — “we are only topping up a natural mineral” — left a lot out.
The question I cannot get away from is simpler than the cavity debate.
What does this chemical do in a human body, day after day, in the amounts we actually drink?
Until that is answered for the people who actually drink the water — not only for twenty adults on a single morning — we are the experiment.
Your town is not every town.
Fluoride in the tap is not one national phone number or web page. Some cities add it. Some never did. Some have naturally occurring fluoride in the groundwater and add nothing. Some don’t. The concentration on the Consumer Confidence Report — the water-quality report your utility has to publish every year — is the place to start. It will show a fluoride number. Read the notes. Utilities often say the source is “natural deposits” and “a water additive.” That additive, in most of the systems that adjust the level, is hydrofluorosilicic acid. If the report is vague, call the plant and ask what they feed and what the finished water tests.
CDC’s fluoridation pages list which systems adjust. State health departments keep the same lists. Two houses in two counties in the same state can be on different water.
You do not need a federal committee to look at your own glass. You do need the report.
Agencies can take decades to reopen and explore the safety of a chemical that is already in the pipes. A person does not have decades. The history is more complicated than we were told. The small blood studies are not a lifetime. The open questions from 2006 are still open questions.
In the meantime, we are on our own. That means reading the water report, adding up the other sources in the house, testing our own bodies, eliminating the chemicals and quiting to wait for someone else to figure out what a safe amount of a toxic chemical looks like to your body.
Sources
EPA, Fluorosilicic Acid Supply Chain Profile (Dec. 2022), EPA 817-F-22-028
https://www.epa.gov/system/files/documents/2023-03/Fluorosilicic%20Acid%20Supply%20Chain%20Profile.pdf
CDC, 2022 Water Fluoridation Statistics (209 million; 62.8% of U.S. population)
https://www.cdc.gov/fluoridation/php/statistics/2022-water-fluoridation-statistics.html
CDC Community Water Fluoridation
https://www.cdc.gov/fluoridation/index.html
CDC fluoridation timeline (Grand Rapids, 1950 endorsement)
https://www.cdc.gov/fluoridation/timeline-for-community-water-fluoridation/index.html
NIDCR, The Story of Fluoridation (McKay, Churchill, Dean, Grand Rapids)
https://www.nidcr.nih.gov/health-info/fluoride/the-story-of-fluoridation
1995 Surgeon General statement on community water fluoridation
https://archive.cdc.gov/www_cdc_gov/fluoridation/guidelines/1995-surgeon-generals-statement-on-community-water-fluoridation.html
CDC MMWR, Engineering and Administrative Recommendations for Water Fluoridation, 1995
https://stacks.cdc.gov/view/cdc/5491
U.S. Patent 2,152,364, Swenson, “Recovering values from phosphate rock” (1939 issue of 1937 application)
https://patents.google.com/patent/US2152364A/en
U.S. Patent 3,024,086, “Disposal of fluorine wastes”
https://patents.google.com/patent/US3024086A/en
U.S. Patent 2,728,634, Miller, “Process of treating phosphate rock…” (filed July 13, 1953; issued 1955)
https://patents.google.com/patent/US2728634A/en
- L. Hill and K. D. Jacob, “Phosphate Rock as an Economic Source of Fluorine,” AIME (1955)
- R. Hendrickson, Journal of the Air Pollution Control Association (1961) — Florida belt fluoride emissions
Scott Hamilton Dewey, “The Fickle Finger of Phosphate,” Journal of Southern History (1999)
https://www.jstor.org/stable/2588134
The Ledger (Lakeland), “Cattle Suffered Due to Fluoride” (June 21, 2004)
https://www.theledger.com/story/news/2004/06/21/cattle-suffered-due-to-fluoride/26119647007/
- J. McClure, “Availability of fluorine in sodium fluoride vs. sodium fluosilicate,” Public Health Reports (1950)
https://pubmed.ncbi.nlm.nih.gov/15440180/
AWWA founding, March 29, 1881, St. Louis
https://www.awwa.org/who-we-are/
Edward T. Urbansky, “Fate of Fluorosilicate Drinking Water Additives,” Chem. Rev. (2002)
https://pubmed.ncbi.nlm.nih.gov/12059264/
- Maguire et al., “Bioavailability of fluoride in drinking water,” J. Dent. Res. 84(11):989–993 (2005)
https://pubmed.ncbi.nlm.nih.gov/16246928/ - M. Whitford et al., “Pharmacokinetics of ingested fluoride: lack of effect of chemical compound,” Arch. Oral Biol.53(11):1037–1041 (2008)
https://pubmed.ncbi.nlm.nih.gov/18514162/
National Research Council, Fluoride in Drinking Water: A Scientific Review of EPA’s Standards (2006)
https://nap.nationalacademies.org/catalog/11571/fluoride-in-drinking-water-a-scientific-review-of-epas-standards
EPA Consumer Confidence Reports
https://www.epa.gov/ccr
CDC Water Fluoridation Data and Statistics
https://www.cdc.gov/fluoridation/php/statistics/index.html

Linda Wulf
Linda Wulf is a cancer rebel, advocate, and independent researcher. Diagnosed in 2023 with primary CNS lymphoma, she declined standard chemotherapy and pursued a root-cause, immune-supporting path. Twenty-three months cancer-free via root-cause approach.