When a doctor prescribes a medication, how much do we really know about why it’s being used for our condition? How effective it is? How it was approved, and what it’s supposed to do? Does it help my condition? Is it off-label and exactly what does that mean?
A couple of years ago, I found myself in a hospital room with a brand-new diagnosis: a “rare disease”—an inoperable, incurable brain cancer (primary central nervous system lymphoma, or PCNSL). This was not how I pictured my later years. From the moment I arrived at Mayo Clinic, I knew my issues were tied to my teeth—a systemic dental infection fueling inflammation throughout my cranium. I eventually found my path to wholeness, but along the way, I learned things I wish I’d known sooner. If this resonates, maybe it’ll help you too.
I’ve covered key pieces of this puzzle in previous articles on my site (jjunr.com):
How the government established the framework to support this rare disease (e.g., Orphan Drug Act and beyond) read: From Temporary Fix to Permanent System
And in The Night I Saw Pharma’s Names on My Cancer Protocol, I tie it all together—revealing the interconnectedness of the industry (standard protocols and their connections with pharma-driven solution) versus the patient’s lived reality, choices, and potential for root-cause healing outside the system.
This piece focuses on the medications themselves—how the industry evolved, and what it means for anyone caught in it. ...
What Is Off-Label Use?
Off-label use means a doctor prescribes an FDA-approved drug for a purpose, dose, or patient group not on the official label.
It’s legal and common in the US (10-20% of prescriptions overall, often higher in oncology). Doctors have this flexibility because the FDA regulates drug approval and manufacturer promotion—not how physicians practice medicine.
This has been allowed since the early FDA laws (1906 Pure Food and Drugs Act, strengthened in 1938 and 1962), which separate drug regulation from medical practice.
Many off-label uses become standard through evidence and experience and are not inherently experimental or risky.
Brief History of Off-Label Drug Use
1906: Pure Food and Drugs Act — Required honest labeling; preserved physician freedom.
1938: Federal Food, Drug, and Cosmetic Act — Proof of safety required; affirmed FDA doesn’t control medicine.
1962: Kefauver-Harris Amendments — Proof of efficacy via trials; labels became specific, defining “off-label.”
1983: Orphan Drug Act — Incentives for rare diseases (<200,000 patients); led to approvals but also loopholes like “salami slicing” subsets for exclusivity and high prices.
1990s–Present: Limited off-label info dissemination allowed; ~20% prescriptions off-label, especially in cancer—scrutiny over promotion and costs.
How Does This Translate to the Individual?
Doctors aren’t required to get special written consent for off-label use (beyond general admission consents). It’s up to you to know this and advocate for yourself. Let me share one drug experience that sent me down the rabbit hole. Rituximab was my wake-up call, but the same questions apply to any mediation you are prescribed.
I received two infusions of rituximab (Rituxan/Ruxience). The first was terrifying—I genuinely felt like I was dying. I experienced violent reactions: uncontrollable shivers–my body was in shock. The team reacted quickly, injecting me with the required medications to bring the initial reaction under control, followed by Demerol, I assume to calm me down.
And then they left. As I lay there heavily drugged and recovering, I suddenly realized I had stopped breathing automatically. I had to consciously think “breathe now” just to stay alive. I began flailing my arms and legs desperately—for what felt like hours—waiting for the symptoms to dissipate. It was horrifying.
The team had managed the initial violent reaction but completely missed my frantic efforts to keep myself breathing and conscious in the aftermath. When I later told the doctor about the experience—specifically how I had to deliberately think to breathe—my description was dismissed as an overreaction. But was it really? The black box warning for rituximab, which highlights the risk of serious, including fatal, infusion-related reactions (often involving hypoxia or respiratory issues), would suggest I was fortunate to have survived what could have been deadly.
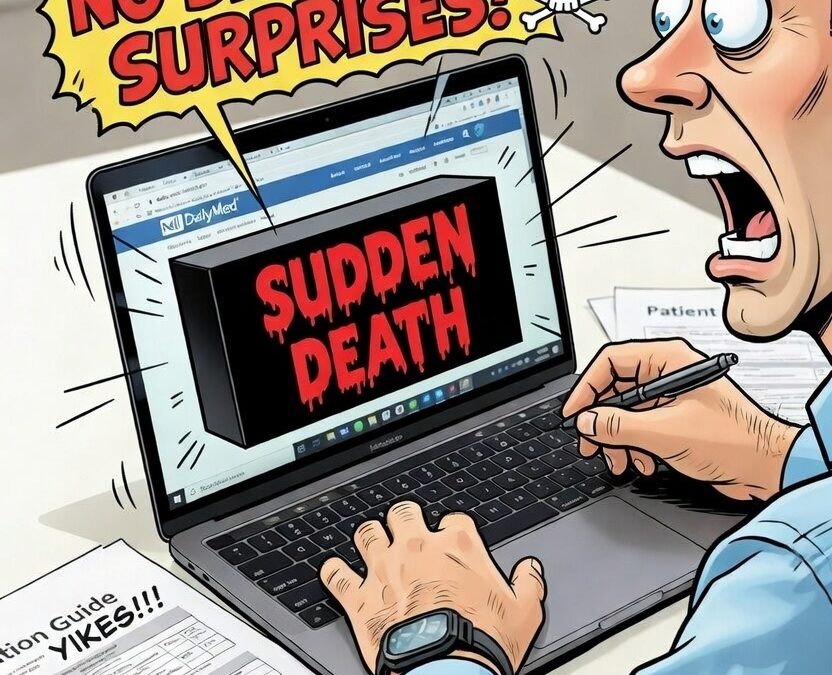
Recently, when I looked up the drug on the NIH DailyMed page, the black box warning hit me hard: I could easily have died from that infusion
WARNING: FATAL INFUSION-RELATED REACTIONS. – Administration of rituximab products can result in serious, including fatal, infusion-related reactions. Deaths within 24 hours of rituximab infusion have occurred. Approximately 80% of fatal infusion-related reactions occurred in association with the first infusion. Monitor patients closely. Discontinue RUXIENCE infusion for severe reactions…
Section 5.1 goes on to detail: Reactions include urticaria, hypotension, angioedema, hypoxia, bronchospasm, pulmonary issues, shock, anaphylaxis, or death—often in the first 30–120 minutes. Premedicate with antihistamine, acetaminophen; for some indications, steroids like methylprednisolone. Manage with epinephrine, oxygen, etc. Reduce rate or stop if severe.
They give multiple drugs just to safely administer this one. And for my case? Zero evidence it helped my variation of PCNSL.
The hospital charged high amounts for these drugs: On December 7, 2023, the rituximab-pvvr (RUXIENCE) injections totaled $11,455. Two weeks later, on December 21, the biosimilar rituximab-abbs rose to $14,063—a roughly 23% increase. Strange how the “cheaper” biosimilar option wasn’t cheaper. Biosimilars are marketed as cost-savers through competition, but in practice (with hospital markups, list prices, or other factors), they don’t always deliver the expected savings to patients or systems—especially in off-label use.
The Clinical Studies Behind the Approval
The DailyMed label for RUXIENCE cites studies from the original Rituxan (not new ones for the biosimilar). These are from Genentech/Roche and Biogen (original developers/marketers), often with academic/cooperative groups (e.g., ECOG, German study groups).
They focus on:
Relapsed/refractory low-grade/follicular NHL (single-agent rituximab).
Adding rituximab to chemo (CVP or CHOP) for untreated follicular or diffuse large B-cell NHL.
CLL with fludarabine/cyclophosphamide.
No large trials for PCNSL appear in the—efficacy data bridges from those original pharma-sponsored studies showing benefits like better response rates and survival in systemic NHL/CLL.
Pfizer (RUXIENCE maker) did smaller biosimilarity trials to prove it’s similar to Rituxan, but the core approval relies on Roche/Biogen’s foundational work. (Truxima/rituximab-abbs has its own separate label, but draws from similar foundational data.)
Profit Ties: Roche/Biogen profit from branded Rituxan (billions historically). Pfizer (and others like Teva for Truxima) profit from biosimilar versions, capturing market share. The original positive data drives sales for all—yet as my billing showed, promised price competition doesn’t always materialize in real-world charges.
Why Transparency Matters
You deserve to know: Is this approved for my exact cancer? Is this product going to help me? What are the real risks? How does it work? Searching DailyMed yourself reveals a lot.
My severe reaction matched the black box warning—validating my experience. Asking questions empowered me.
The Key Resource: NIH’s DailyMed Database
This free tool from the National Library of Medicine is a game-changer for patient advocacy. It gives you the official FDA-approved drug labeling—straight from the source, reformatted for easier reading.
Here’s how to use it step by step to dig into any prescribed medication:
Find the Exact Drug Name: Check the drug’s label or your medical billing statement (it’s often buried in the detailed codes—mine came from Mayo Clinic). Use the precise name, like “rituximab-pvvr (RUXIENCE)” or the NDC code if you have it, for the best match.
Search DailyMed: Go to the NIH DailyMed Database and enter the drug name (or NDC/active ingredient). Locate your specific medication/version.
Review Key Sections Yourself First:
Indications and Usage: Compare approved uses vs. your condition—is it on-label or off-label?
Warnings and Precautions: Look for black box warnings, serious risks, and infusion reactions (like mine).
Clinical Studies: Examine the trials behind approval. Note:
Do they include a placebo, or are they just comparing against similar drugs?
What’s the study size? (Rare disease trials are often small, limiting reliability.)
What are the trade-offs? (e.g., Is it worth long-term side effects for just 2 extra months of survival?)
What are the long-term side effects?
Take It Further with AI: Once you’ve found the right page, copy the full URL from your browser (it will look something like https://dailymed.nlm.nih.gov/dailymed/drugInfo.cfm?setid=…). Paste that exact link into an AI platform (like Grok, ChatGPT, or similar). Then ask your specific questions about that medication. This keeps the AI focused on the official details and helps you unpack complex sections—like interpreting study results, risks, or why certain data might not apply to your case.
Conclusion
Knowledge reduces fear and builds better decisions. Explore these tools, ask questions, share experiences (here or in communities). Wishing strength to everyone navigating this—may you find your path to wholeness too.
For the last three parts, we’ve traced how the Orphan Drug Act of 1983 started with genuine compassion, how the Rare Diseases Act of 2002 turned rare conditions into permanent federal infrastructure, and how the result is a trillion-dollar self-perpetuating industry that multiplies labels, inflates spending, and rewards management over cures. The system has no incentive to reduce disease prevalence, no requirement to prove fewer people need lifelong therapy, and no interest in exploring root causes when pharmaceutical control is more profitable.
What follows is real-world counter-evidence—one patient’s outcome that challenges the prevailing model. This is my story.
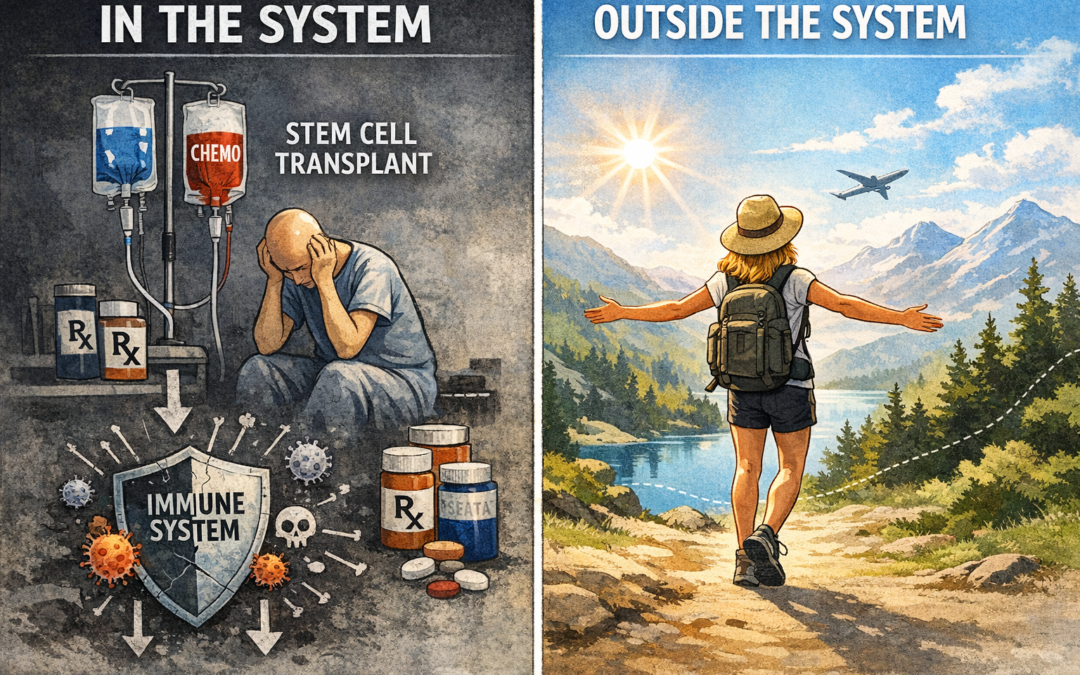
In late 2023, I was diagnosed with Primary CNS Lymphoma (PCNSL)—a “rare, aggressive, incurable” brain cancer. The standard protocol calls for high-dose methotrexate (HD-MTX), rituximab, temozolomide, and lifelong maintenance or repeated cycles of HD-MTX to keep this cancer from returning. If I was “lucky,” after 5-6 rounds, I’d qualify for an autologous stem cell transplant—harvesting my own cells to rebuild marrow destroyed by the chemo, all while the industry search for a “cure” drags on. A search first formalized in 1971 by Richard Nixon with the National Cancer Act, when he announced that if we can cure Hodgkin’s we can cure cancer.
At my doctor’s urging, I started HD-MTX just 10 days after landing in the ER—and a week after heavy antibiotics targeted what I believed was the real trigger: an active and chronic dental infection sparking my body’s lymphatic overreaction. While I was learning about the healthcare system and finding my way out, I went through four cycles of HD-MTX, and one dose each of rituximab and temozolomide.
By January 17, 2024, I’d gathered enough intel to plot my escape. Navigating my healthcare portal, I scrutinized my brain scans. What I saw didn’t scream “aggressive”—no rapid changes, just a body responding. It made more sense to challenge the story I was being told than to continue poisoning myself. I was learning in real time, unraveling rules and assumptions I wished I had known before the diagnosis. |
That day, admitted for what became my final cycle of HD-MTX, I refused anti-nausea meds. Vomiting, I argued, was my body’s natural defense against toxins—something it had done with cigarettes, alcohol, or even overwhelming experiences in my past. Why suppress that signal? Andrew Walker, the PA on shift, came in to talk. He listened thoughtfully as I shared my journey, my search for truth, and my question: Was it the antibiotics, the steroids or MTX driving any response? When he walked out that door, I expected to be shown the door—maybe even discharged from the program after he talked with the team.
Instead, he returned with “the Team” – Dr. Mrugala, Dr. Rosenthal, and others. The team couldn’t risk uncontrolled vomiting—I understood that. I told them plainly I believed my body could heal if I addressed the root cause. I said ” I am fearfully and wonderfully made.”
They listened, whether they heard me or were just nodding in agreement to get past this crisis. In my mind, I had just agreed to this last round, including anti-nausea for safety, on one condition: I’d head home to my octogenarian periodontist to tackle the infection. And that’s what I did. Looking back now, with everything I know, I would have left Mayo’s care on day 9—before ever starting chemotherapy. But fear and pressure kept me in longer than I should have stayed.
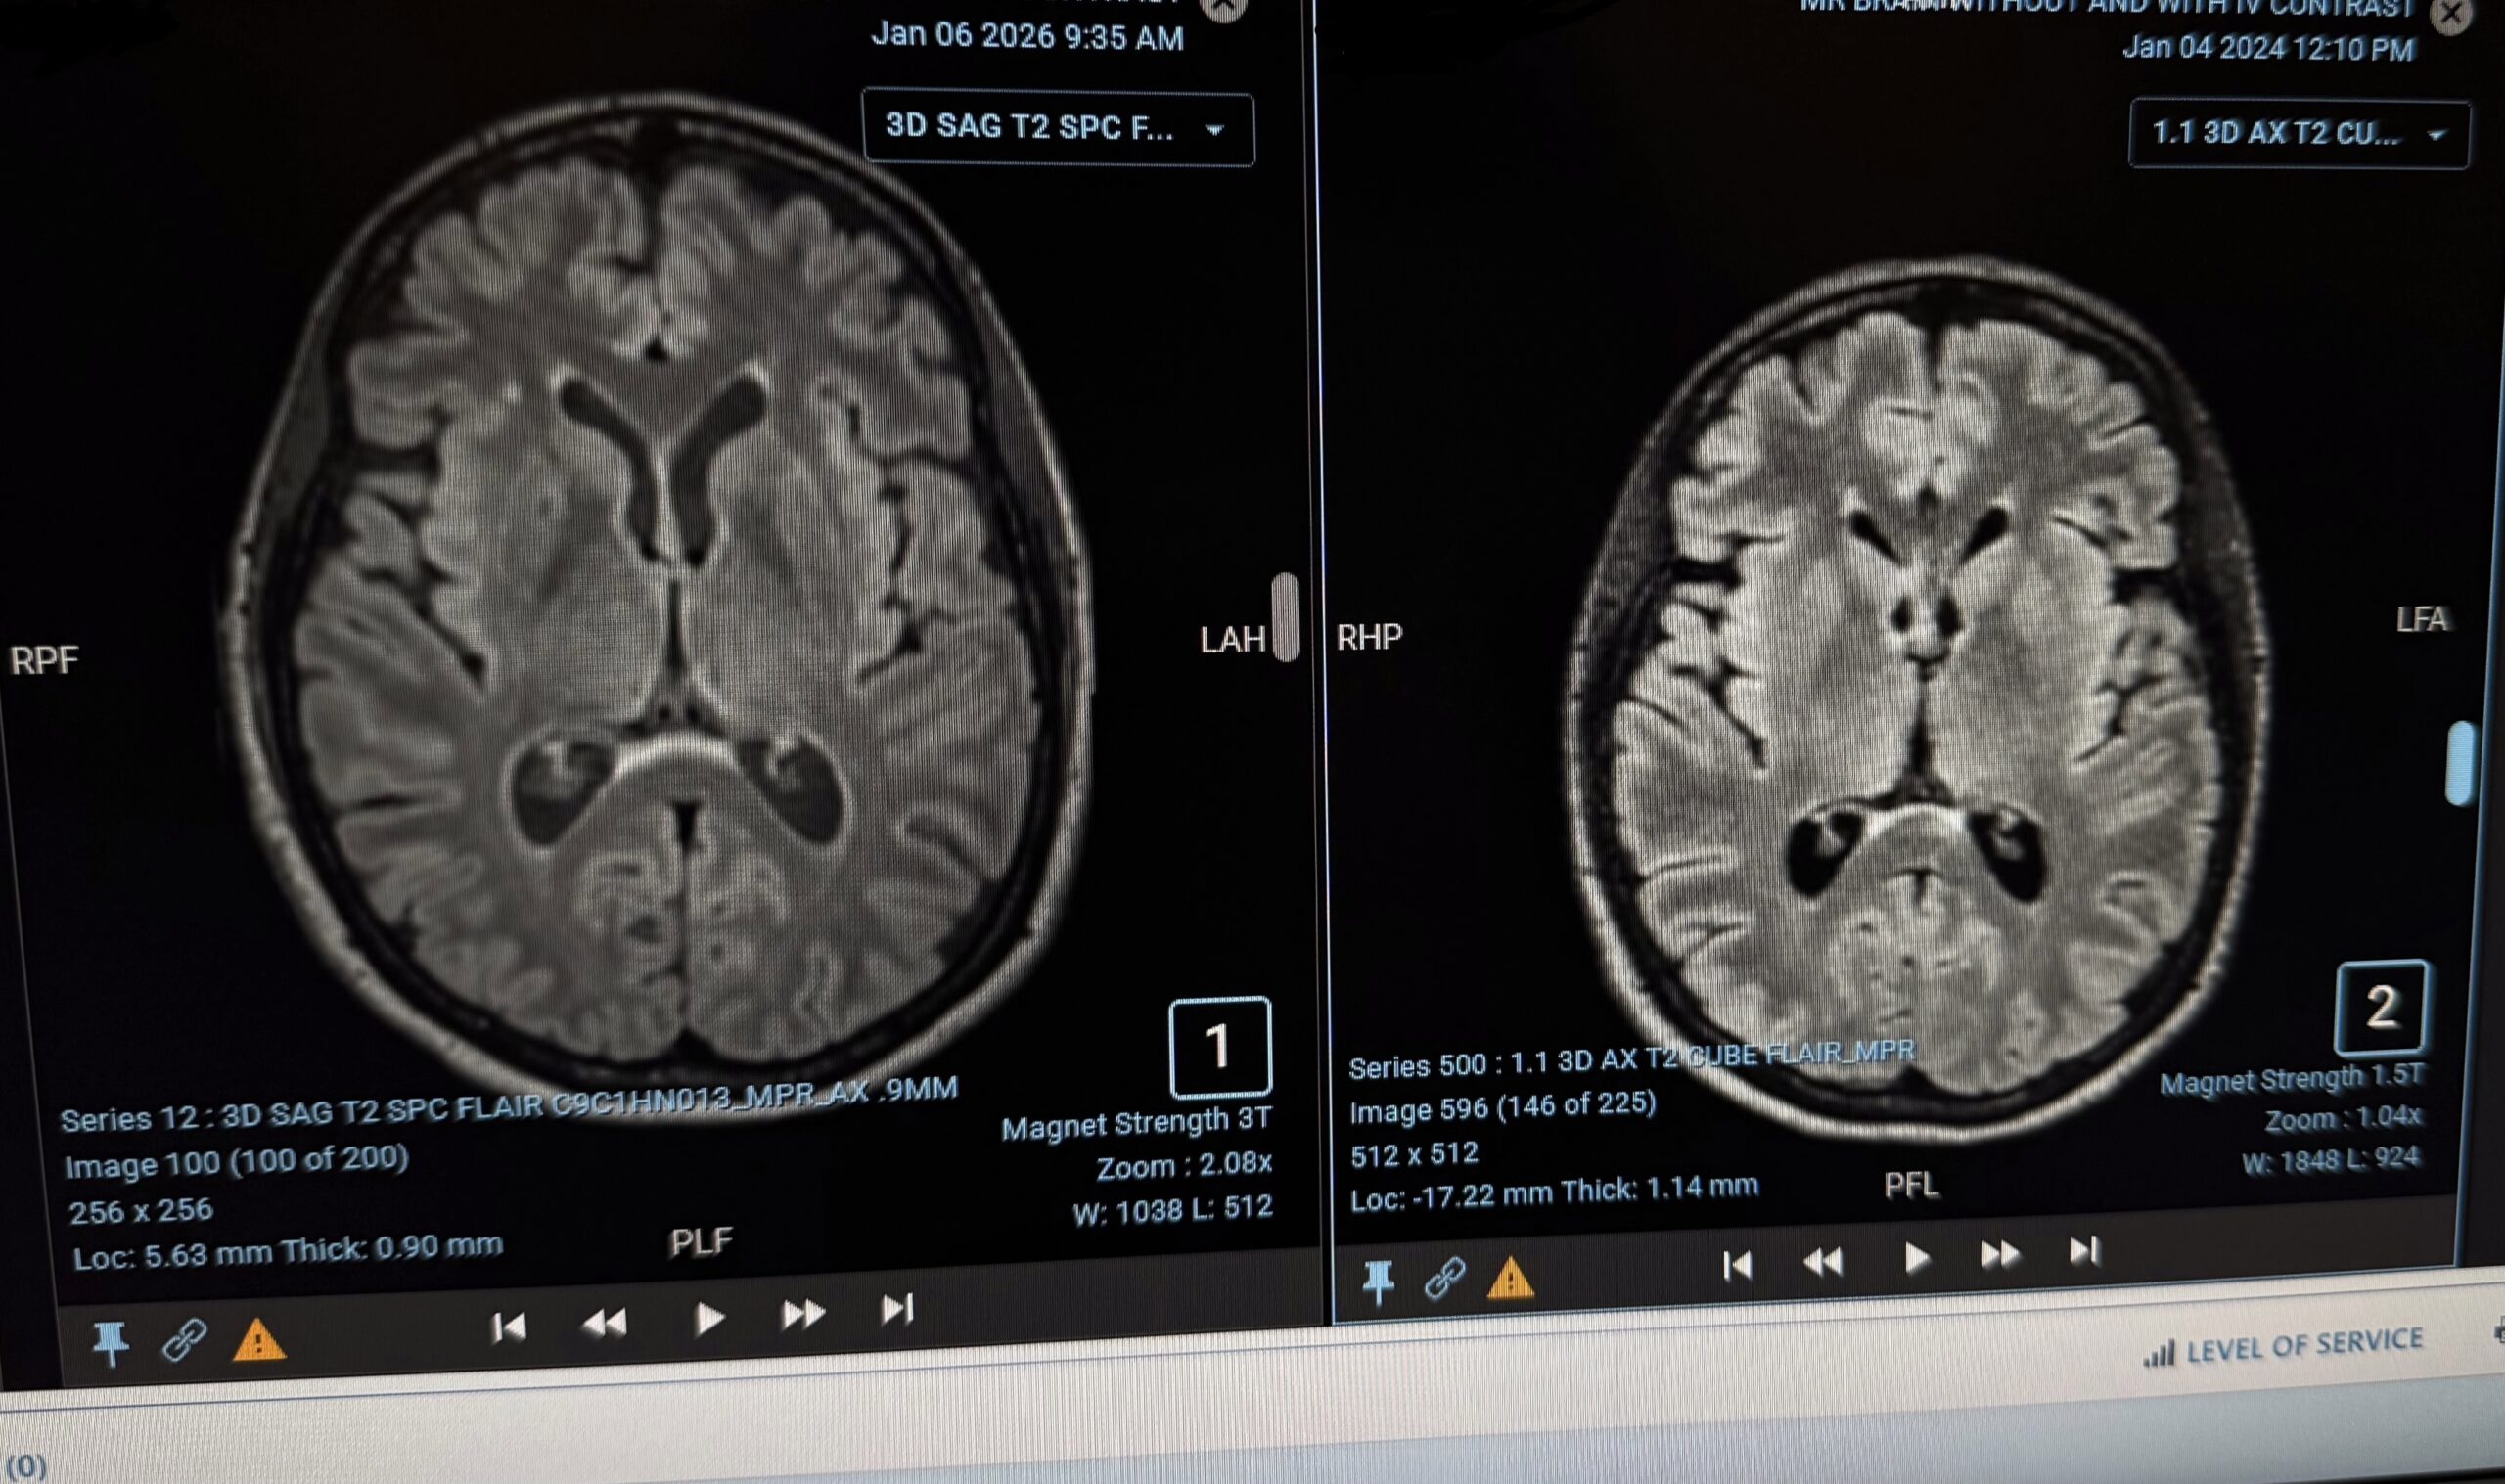
Fast-forward two years. My January 2026 MRI shows continued stability, with no new lesions and no meaningful progression of FLAIR hyperintensities. In the side-by-side comparison, the earlier scan (right) resembles a “lion’s face,” its mane formed by flaring abnormalities around the brain’s center. In the most recent image (left), those features appear subdued and organized—the central structures tamed, the brain moving from roaring to resting.
On January 19, 2026, I returned to my doctor, and we reviewed the imaging. We agreed that I would permanently step away from Mayo Clinic’s monitoring of my “disease.” There was no fanfare when I walked out—no longer their patient. No one is ringing my “I beat cancer” bell but me.
I am no longer living on borrowed time. I am living on healing on my terms—without endless toxicity.
The system is structured around features that are rarely disclosed to patients. These are the priorities and mechanisms I wish I had understood earlier:Drugs are prioritized over whole-body health. Medical care often follows rigid treatment playbooks that focus on pharmaceuticals, and once those regiments are established, they are rarely questioned or revisited.
Suppression replaces biological support. Rather than helping the body’s natural defense systems do their job, many treatments are designed to shut them down—most notably by targeting the lymphatic and immune systems first, even as they are actively working to protect and stabilize the body.
Approvals continue without ongoing proof. Once a drug is approved, it can remain in use indefinitely, even when long-term effectiveness is not regularly re-evaluated or meaningfully tracked.
Rules are bent for labels, not outcomes. Regulatory flexibility around “rare” disease classifications serve faster approvals and bureaucratic objectives rather than ensuring real, patient-centered results.
Important gaps are left uncovered. Insurance routinely excludes testing that could explain ongoing symptoms—such as evaluations for gadolinium toxicity—simply because those tests fall outside standard pathways.
Drugs gain freedom, patients do not. After approval for a single cancer indication, drugs can be reused broadly in small patient groups without rigorous endpoints, long-term follow-up, or meaningful outcome tracking.
Treatment rules are shaped by industry. Pharmaceutical companies develop the drugs, influence testing, and help shape hospital protocols—often through industry-entangled organizations like National Comprehensive Cancer Network—aligning care more closely with profit and stock performance than with patients’ long-term well-being.
Language is used to narrow choices. Fear-based terms like “aggressive,” “incurable,” and “unbeatable” are routinely used to frame disease, discouraging questions and implying patient helplessness rather than describing biological reality.
Patients are kept in a treatment loop. Most are never told that stopping, monitoring, or supporting the body is an option, ensuring continued enrollment in regiments that sustain dependency, funding streams, registries, and repeat interventions instead of resolution.
My message to anyone reading this series: You are not a disease label. Your body is remarkable. When the protocol feels like destruction, question it. Seek second opinions. Trust your intuition. Explore nutrition, detoxification, inflammation reduction, and lifestyle—the things the system sidelines because they can’t be patented or scaled. Healing is possible. Freedom is possible.
The industry we have created thrives on dependency. But individuals can break free—and when we do, we prove the whole narrative wrong.
The Orphan Drug Act of 1983 and the Rare Diseases Act of 2002 were intended to reduce suffering by accelerating cures for rare conditions.
After more than four decades and billions in public spending, rare diseases have not diminished. They have multiplied—while an already bloated government spending program continues to expand, with no indication of an endpoint.
This is what has happened:
The Growth in Identified Rare Diseases
From just over 6,000 recognized in 2002, the count now exceeds 10,000 (per NIH, NORD, and Orphanet estimates as of 2025–2026), with new subtypes and classifications added yearly through advances in genetics, molecular diagnostics, and data aggregation. This outcome is not accidental; it is a feature of the current model.
Year
Estimated Number of Rare Diseases Identified
2002
~6,000
2009
~5,850
2016
~6,080
2020
~7,000
2022
~10,000+
2026
~11,250+ (growing by ~250-300 annually)
More labels translate to more patients identified, more protocols developed, and more lifelong management—not fewer people suffering. The economic burden reflects the same pattern: Rare diseases cost the U.S. nearly $1 trillion annually. Trillions are being spent collectively, yet meaningful reductions in prevalence or treatment dependency remain elusive. The overwhelming majority of rare diseases still have no cure; only about 5% have FDA-approved treatments.
Government Spending by Agency (Billions USD)
The increase in identified diseases correlates directly with massive increases in public spending, particularly on healthcare coverage (Medicare/Medicaid) as opposed to core research (NIH).
Year
NIH (Research)
FDA (Grants)
Medicare/Medicaid (Treatment)
Total Approx.
2002
~$1.0B
$0.013B
Not Tracked
~$1.01B+
2009
$3.1B
$0.014B
~$3.0B
~$6.11B+
2016
$4.9B
$0.016B
$10.0B
~$14.92B+
2020
$6.0B
$0.016B
$18.5B
~$24.52B+
2022
$7.2B
$0.017B
$27.1B
~$34.32B+
2026
$4.4B (Est.)
$0.019B
$33.0B (Est.)
~$37.42B+
Activity vs. Progress
This outcome is by design. The system equates activity with progress: more grants awarded, more registries established, more approvals granted, more subtypes defined. Incentives reward participation and expansion—tax credits, market exclusivity, public-private collaborations—but impose no outcome-based accountability. There is no requirement to demonstrate fewer patients over time, fewer people needing lifelong therapy, or actual disease reduction. When prevalence rises or new diagnostic categories emerge, the funding continues unabated.
Regulatory flexibility, originally intended to address small patient populations, has granted pharmaceutical companies considerable leeway:
Smaller Trials: Often involving only dozens of participants rather than thousands.
Surrogate Endpoints: Using laboratory markers deemed “reasonably likely” to predict benefit, rather than direct evidence of clinical improvement like extended survival.
Accelerated Approvals: Allowing initial marketing based on weaker data while post-approval confirmatory studies are frequently delayed or remain incomplete.
What began as exceptional accommodation has become routine, lowering evidentiary thresholds and enabling more drugs to reach the market with limited proof of resolving the underlying disease.
The Transparency Gap and Sidelined Interventions
Patients frequently receive incomplete information. While physicians must obtain informed consent, no federal rule mandates explicit disclosure that a drug is being used off-label, that supporting evidence derives from small trials or surrogate markers, or that long-term benefits and risks remain uncertain. This transparency gap places the full burden of uncertainty and potential harm squarely on the patient.
Non-patentable interventions—chronic infections, inflammatory drivers, environmental exposures, nutritional optimization, metabolic repair—are systematically sidelined. They lack the exclusivity or high-margin potential needed to attract large-scale funding or study. The system overwhelmingly favors scalable, reimbursable pharmaceutical solutions over investigation of root causes.
The human toll is profound and unforgivable. Patients endure aggressive, body-destroying regimens while underlying triggers go unexplored. They are told their disease is aggressive, rare, and incurable, then funneled into protocols designed for control rather than resolution.
What we really have created is a massive, well-funded, self-perpetuating industry: government-business partnerships, advocacy ecosystems, and lifelong treatment protocols—all thriving on more recognized diseases, more spending, and more dependency. Not progress. Institutionalized failure.
The next part begins at the moment a patient realizes they are not being guided toward recovery but managed as an endpoint in a system with no incentive to make them well—and decides to leave it.
Part 1 examined how the Orphan Drug Act of 1983 used incentives to correct a market failure—and why it worked. But that law was never intended to create a permanent system.
In 2002, that changed. With the Rare Diseases Act, rare diseases stopped being an exception to the medical marketplace and became embedded in the federal research infrastructure itself. This essay examines how a temporary solution quietly sowed the seeds for something much larger, with consequences that were not anticipated at the time.
The Orphan Drug Act of 1983 has proven its value. By offering tax credits, grants, and seven years of market exclusivity, it spurred hundreds of orphan drug designations and approvals where none had existed before. What was once a neglected corner of medicine began to attract real investment. But the law’s incentives were narrowly focused on drug development—temporary bridges over a market gap. Rare diseases were addressed as exceptions, not yet embedded as a standing priority within the medical system.
In 2002, Congress took the next step. On November 6, President George W. Bush signed the Rare Diseases Act into law. Unlike the Orphan Drug Act, which relied on pharmaceutical incentives, this legislation embedded rare diseases directly into the federal research infrastructure at the National Institutes of Health (NIH).
The Act’s congressional findings captured the scale of the problem at the time: more than 6,000 known rare diseases affecting an estimated 25 million Americans, many of whom lacked effective treatments due to limited commercial interest. The law sought to address this by formalizing rare disease research through several key mechanisms:
Establishing a statutory Office of Rare Diseases—now the Office of Rare Diseases Research (ORDR) within the National Center for Advancing Translational Sciences—to coordinate NIH efforts
Recommending a national research agenda for rare diseases
Supporting education, workshops, and symposia to identify research opportunities
Authorizing grants for regional centers of excellence, which led to the creation of the Rare Diseases Clinical Research Network (RDCRN) to support collaborative clinical studies, training, and patient engagement
The Act also standardized the definition of a rare disease as any condition affecting fewer than 200,000 people in the United States—the same threshold used in the Orphan Drug Act—and authorized modest appropriations (approximately $4 million annually from FY 2003–2006). Though limited in dollar terms, this funding signaled a long-term federal commitment.
The shift was profound. Rare diseases were no longer addressed solely through targeted incentives; they became a formalized category within federal medicine, complete with dedicated offices, recurring grant pipelines, disease registries, and collaborative frameworks linking government, academia, industry, and advocacy organizations. Across this ecosystem, sustained participation—not resolution—was rewarded.
Since 2002, this infrastructure has driven substantial investment. Federal funding coordinated through ORDR, RDCRN cycles, and related NIH grants is estimated at $2–4 billion, with RDCRN alone exceeding $500–600 million across its five funding cycles. The system expanded research capacity, built networks, and increased visibility for rare conditions. But the numbers also reveal a deeper paradox. While the 2002 Act referenced roughly 6,000 known rare diseases, the recognized total has since climbed well beyond 10,000. This increase is often attributed to advances in genetics, molecular diagnostics, and data aggregation—suggesting that many conditions always existed but were previously unidentified. Yet that explanation is incomplete.
Over the same period, Americans have experienced unprecedented and cumulative exposure to thousands of synthetic chemicals, food additives, pharmaceuticals, and environmental contaminants—many approved under fragmented regulatory oversight and rarely studied for long-term, low-dose, or synergistic effects. Rather than asking whether this expanding chemical burden is contributing to disease emergence, the system has largely focused on classification and management after the fact. More diseases are cataloged, more subtypes defined, and more patients enrolled—not necessarily because detection has improved alone, but because upstream causes remain unaddressed.
Rare disease was now a permanent federal program to manage, not a temporary gap to close. No built-in mechanisms required measuring reductions in disease prevalence, cures achieved, or fewer patients needing lifelong care. Success became increasingly tied to activity—more studies, more centers, more funding—rather than to resolution.
What began as compassion had evolved into something enduring: a formal system with billions invested, expanding infrastructure, and a growing catalog of recognized diseases. After more than four decades, what has that investment actually produced?
When Compassion Met Incentives: The Orphan Drug Act of 1983 (Part 1 of 4)
In the late 1970s and early 1980s, families across America watched helplessly as loved ones died from rare diseases—conditions so uncommon that pharmaceutical companies saw little profit in developing treatments. Doctors had few options. Researchers had limited funding. Patients had no real leverage. These “orphan” diseases affected small populations, often fewer than 200,000 Americans, making them unappealing to market-driven drug development.
Congress responded with bipartisan urgency. On January 4, 1983, President Ronald Reagan signed the Orphan Drug Act (ODA) into law, amending the Federal Food, Drug, and Cosmetic Act to encourage the creation of drugs for rare diseases.
The core idea was simple and humane: If private industry wouldn’t invest because the patient pool was too small to recoup costs, the government would make it worthwhile through targeted incentives. Those incentives were designed to reduce risk, shorten timelines, and make rare disease research economically viable.
Key provisions included:
Orphan drug designation: Companies could apply to the FDA for a drug to be designated as an “orphan” if it targeted a rare disease (defined as affecting < 200,000 people in the U.S., or more if no reasonable expectation of profitability). This unlocked benefits early in development.
Tax credits: Up to 50% of qualified clinical trial costs could be claimed as a credit, reducing the financial burden of research.
Market exclusivity: Upon FDA approval, the first sponsor received seven years of exclusive marketing rights for that drug in treating the designated rare condition—no direct competitors could enter the market during that period.
Grant funding: The FDA’s Office of Orphan Products Development awarded research grants to support orphan drug studies.
Fee waivers: Exemption from Prescription Drug User Fee Act (PDUFA) application fees.
Regulatory support: Priority review, closer FDA coordination, and access to expedited pathways.
These carrots worked. Before 1983, the FDA had approved only about 10 drugs that would qualify as orphans. In the decades since, hundreds of orphan designations have led to over 500 approvals for rare disease treatments, transforming what was once a neglected area into one of sustained innovation.
At its heart, the 1983 Act was an act of compassion translated into policy—bridging a market failure to give hope to patients long ignored. It proved that targeted government intervention could spur private investment where pure economics had failed.
Yet this success planted seeds for what came next: a system that, over time, grew far beyond its original intent.
What began as a targeted solution to a market failure would not remain temporary. In the years that followed, rare disease moved from exception to infrastructure—embedded into federal research, funding, and regulation.
Midnight, January 2024, Mayo Clinic room. I was sitting in my room at the Mayo Clinic, still recovering from another high-dose methotrexate infusion. The side effects were accumulating—brain fog, weakness, immune depletion—but the unease that grew inside me wasn’t just physical. It was something deeper, something instinctual, something that wasn’t right. That night, I opened my laptop and typed a question into ChatGPT: “Who writes the guidelines for central nervous system lymphoma?” The answer came back quickly: the National Comprehensive Cancer Network (NCCN)—a non-profit alliance of elite cancer centers across the United States that produces the protocols used in nearly every major institution. The same guidelines that were directing my care.
When I visited the NCCN website that night, something unexpected appeared. At the top of the guidelines submission page, I saw the names AbbVie, Genentech, and Pfizer. The wording implied that these companies weren’t just supporters but gatekeepers—positioned to influence which drugs and protocols made it into the standard of care, long after the research was done and the manufacturing complete. Moments later, the page shifted—replaced by a list of credentialed researchers from major institutions like Stanford, Harvard, and Mayo Clinic. But that fleeting glimpse revealed a deeper truth: the protocols steering my care appeared, if only briefly, to answer to industry interests—not to independent science.
That was the decisive moment it changed for me.
When the Disconnect Became Clear
My decision to walk away didn’t begin with ChatGPT, or NCCN, or even the protocols. It started weeks earlier, on December 5, 2023, when I first heard the phrase “inoperable but treatable.” I remember writing in my journal that day and feeling something crack: a disconnect between what I knew about nature, healing, and inflammation—and what the doctors were saying. They told me this cancer had no cause and no cure, but showed some enthusiasm about how we hope to figure it out soon, almost like a pep talk to join the “let’s beat cancer team.”
It took a little over a month for me to exit the program, but it turns out, I am not a team player. I knew my body’s story: I’d lived with a chronic dental infection, which was active at this time. What they offered wasn’t hope; it was protocol, followed by a lifetime of medical management for the treatment’s side effects. That moment I realized how deeply pharmaceutical companies were tied to the very guidelines directing my care, it didn’t spark the decision. It confirmed it—especially after seeing how the initial antibiotics and steroids had already started turning things around.
A Rare Diagnosis—and Rare Consent
My cancer—Primary Central Nervous System Lymphoma (PCNSL)—is considered rare. That label triggered a specific sequence of events: a diagnosis fast-tracked into treatment, multiple high-risk drugs, and a deeply standardized regimen. What I didn’t fully understand at the time was that many of the drugs in this protocol were either off-label or experimental.
Temozolomide depletes lymphocytes—the very cells I needed to heal.
I had severe reactions to Rituximab (violent immune response).
Vancomycin (severe allergic reaction).
The NCCN guidelines for my disease recommended 12 different clinical trials for the “let’s beat cancer team” and had one brief phrase about healthy living. At no point did anyone stop to ask why I had this cancer—what my body had been exposed to, whether my long-standing dental infection, systemic inflammation, or chemical sensitivities played a role. Instead, I was swept into the treatment protocol: no pause, no curiosity, and no exploration of root causes.
The Orphan Drug and Rare Disease Loophole
My diagnosis—Primary Central Nervous System Lymphoma (PCNSL)—qualifies as a rare disease under the Orphan Drug Act of 1983 and the Rare Diseases Act of 2002, laws enacted to spur research and development for conditions affecting fewer than 200,000 Americans (the threshold for ‘rare’ under the ODA). The intention was noble. The outcome? More slippery. Drugs approved under these acts often:
Benefit from flexible FDA approval standards, like smaller trials or surrogate endpoints.
Receive tax credits of up to 25% for clinical trial costs.
Access competitive federal grants from FDA and NIH, ranging from hundreds of thousands to millions.
Waive FDA user fees, saving companies millions per application.
Gain seven years of market exclusivity for the orphan use—even for off-patent drugs.
In practice, this allows companies to profit from drugs integrated into rare disease protocols, without necessarily demonstrating improved outcomes. And since guidelines like NCCN’s are developed by experts at institutions receiving funding from those same companies, the incentives form a tight circle. According to their own 2020–2023 patient guidelines, the NCCN’s recommendations are based largely on expert opinion and trial availability—not robust long-term outcomes. Even the most recent protocols continue to suggest clinical trials and immunochemotherapy combinations, while failing to acknowledge root causes or preventative strategies. I wasn’t just a patient. I was a participant in a commercial enterprise.
The Economics of “Standard of Care”
Date of Service
Procedure Description
DX Code
Qty
Charge
Price per Unit
Brand
12/7/23
Rituximab-PVR Injection
G93.89
10
$1,909.20
190.92
PFIZER BRAND NAME
12/7/23
Rituximab-PVR Injection
G93.89
50
$9,545.80
190.92
PFIZER BRAND NAME
12/21/23
Rituximab-ABBS Injection
C85.89
10
$2,343.90
234.39
BIOSIMILAR DRUG
12/21/23
Rituximab-ABBS Injection
C85.89
50
$11,719.40
234.39
BIOSIMILAR DRUG
One look at my Mayo Clinic itemized bill told the other half of the story. The pharmaceutical charges were staggering and volatile fluctuating dramatically in a short time frame:
A baffling increase for a “Bio-Similar” drug in such a short time, possibly due to quarterly adjustments in average sales price or hospital markups.
Adding insult to injury, insurance denied coverage in the end because Rituximab is typically for B-cell lymphomas (it targets CD20 on B-cells), and mine did not have involved B-cells.
But it wasn’t just the cost. It was the pattern.
These were the exact drugs I reacted poorly to—triggering violent immune responses, allergic reactions, or systemic crashes. And the manufacturers? Genentech for Rituximab. Pfizer for Vancomycin. Merck and generic suppliers for Temozolomide. Ironically—or perhaps not—Genentech and Pfizer were among the names that briefly appeared at the top of the NCCN guidelines page that night.
These weren’t just medications. They were products in a pipeline—and I was part of the distribution system.
Legal.
All of it codified.
None of it is transparent.
The 2022 NCCN Form 990 shows over $23 million in revenue, with “educational grants” from pharmaceutical firms and corporate “supporters” often tied to the drugs featured in their guidelines. Their own foundation, which funds emerging cancer researchers, lists Genentech, Karyopharm Therapeutics, and Servier as major supporters. The incentives are clear. But for the patient, it’s a blur of white coats and urgency—impossible to distinguish scientific rigor from sales strategy.
What I Did Instead
In January 2024, I made the choice to step off the conveyor belt. It wasn’t out of fear. It was out of awareness.
I turned toward a different path: one grounded in whole-body healing and immune system restoration.
As I reflect on the journey, I realize now that the massive antibiotic regimen combined with steroids I received from the Mayo Clinic the first week I was there put a stranglehold on the infection that was ravaging my lymphatic system, but it did not totally eliminate the infection that was still brewing.
By January 4, 2024, my MRI already showed a positive response to this initial treatment—with a significantly decreased zone of T2 signal abnormality and enhancement in the biopsy-proven CNS lymphoma centered on the posterior body of the corpus callosum, plus no new or progressive enhancement—proving the infection was being addressed without the full chemo protocol they were pushing so urgently.
In addition to dental work (i.e., the removal of the problematic tooth), healing came and continues with holistic practices such as:
Breathwork.
Initially, an extended fast to trigger neural autophagy.
Clean nutrition and mitochondrial support.
Daily detoxification through sauna and exercise.
Elimination of all endocrine-disrupting chemicals in my consumed products.
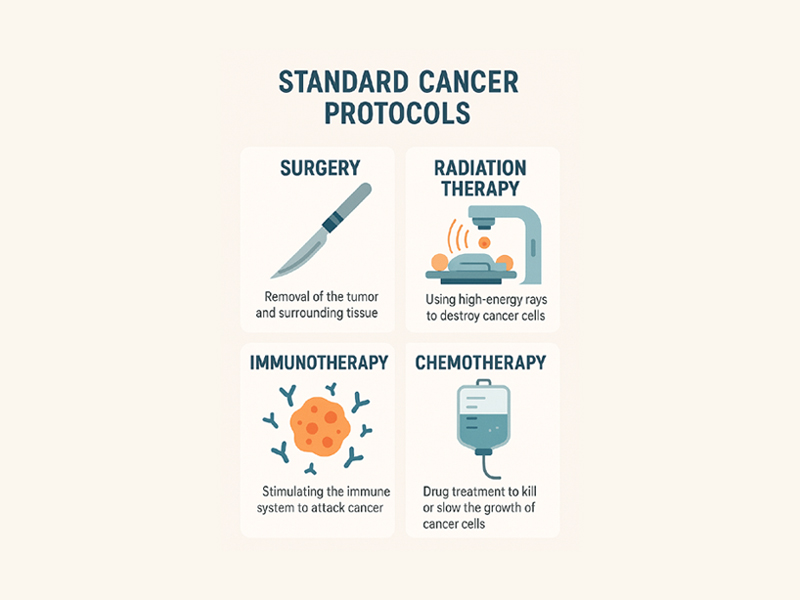
These elements of care help illustrate what is often missing from Standard Cancer Protocols: patient-centered approaches.
Was it scary to walk away from a world-renowned protocol? Yes. But what was scarier was not asking questions.
What the Data Says Now
My last scan, a June 2025 MRI, showed “No masses. No new white matter abnormalities. No active disease.” I expect my next scan (and what will be my last scan; I am done with the waiting and watching for the other shoe to drop) will be stellar.
I’m not claiming that breathwork cured me.
I’m not suggesting that fasting is a magic bullet.
But I am saying this: The system I walked away from didn’t acknowledge what I now believe was driving my illness. And the healing I’ve experienced didn’t come from the protocol. It came from reclaiming agency.
Why I’m Telling You This
Because I’m not alone.
Thousands of patients are being routed into systems that serve drug development, not true recovery.
If you are facing a diagnosis—especially a rare one—ask who benefits. Ask whether your protocol is backed by long-term remission data or short-term pharmaceutical incentives.
Linda Wulf is a cancer rebel, advocate, and independent researcher. Diagnosed in 2023 with primary CNS lymphoma, she declined standard chemotherapy and pursued a root-cause, immune-supporting path. Twenty-three months cancer-free via root-cause approach.